Introduction
In cancer genomics applications, whole-genome sequencing (WGS) can be employed to detect the full mutational profile of a tumor sample. When a normal tissue sample from the same individual is available, somatic cancer variants can be identified as those present in the DNA extracted from the tumor sample that are absent in the normal. Yet, due to confounding affects such as the heterogeneous nature of cancer samples and/or low sample purity, somatic variants are present at a spectrum of frequencies, which makes accurate variant calling challenging.
Low-frequency variants are especially difficult to identify confidently because support may be limited to a few sequence reads and a low level of error might be misinterpreted variants, resulting in false-positive calls. Ideally, we want to minimize false-positive calls to reduce curational burden and drive accurate patient diagnosis and treatment choice. This may be achieved by increasing the stringency of the variant calling algorithm, however, this would also result in missing true variants (false negatives). Somatic variant callers are optimized to deliver the best trade-off between false positives and false negatives genome-wide, but some parts of the genomes are known to produce more false calls than others. Tuning a variant caller to maximize the average performance will lead to underperforming in certain regions.
We developed a method1 that empirically defines regions of the genome with systematically high or low quality in a cohort of samples. This allows us to track systematic sequencing performance by aggregating performance metrics from cohorts of samples. For this analysis, these performance metrics include base quality, mapping quality and average sequencing depth. Using these metrics, we can robustly quantify the significance of deviations from ‘normal’ sequencing quality at each genomic position. It is then possible to derive a threshold and label each position of the genome as high quality or low quality and use these labels to stratify variant calling performance.
We present here an application of this method for cancer variant calling, demonstrating how false-positive and false-negative density is impacted by local systematic quality variability.
Results
1. Modeling the limit of detection of somatic single nucleotide polymorphisms (SNPs) by allele frequency
In its simplest form, the aim of a small variant caller is to discriminate whether at each site a nonreference base call is noise or signal from an allele. Somatic variant callers make no ploidy assumptions and therefore work with no constraints on the expected variant allele frequencies (VAFs). The ability of the caller to correctly identify variants at specific frequencies is limited by sampling factors and we can model signal and error as a binomial distribution with cumulative distribution function (CDF).

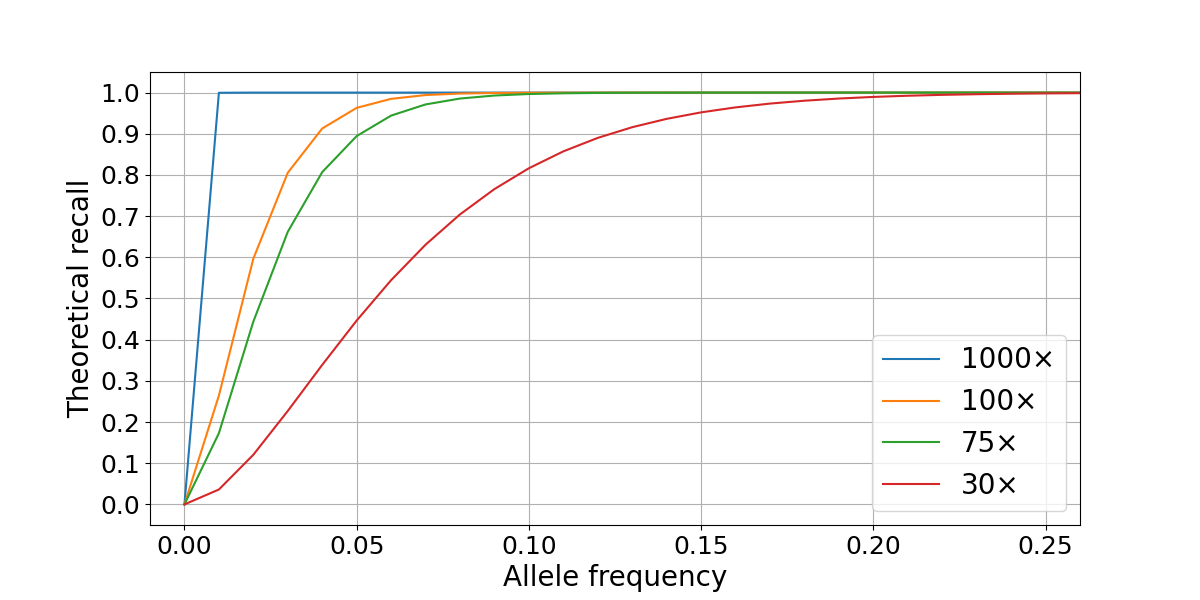
Figure 1: Theoretical recall is computed as the survival function of the signal using a threshold that best approximates a fixed value of Q30. The four lines represent different levels of sequencing depth (30×, 75×, 100×, and 1000×).
In this scenario, sequencing a sample at 30× is enough to confidently detect variants with VAFs ≥ 0.2, but deeper sequencing is necessary to recall variants present at 0.1 VAF or lower. Practically, sequencing cost is a limiting factor to increasing coverage, with tumor sequencing depths of 100× and 75× providing the best compromise between performance and cost. Variant calling accuracy is limited not only by sampling factors but is also affected by local coverage variability and systematic biases in the genome. We will use this model to compare our performance in high- and low-quality regions of the genome.
2. Simulating allele frequencies with admixed samples
To assess WGS somatic recall at a range of VAFs, we leveraged the highly curated truth sets produced as part of the “Platinum Genomes” project2. These consist of high-confidence germline call sets for the 13 members of the pedigree that were derived using Mendelian haplotype consistency. By merging the sequencing data from two parental members of the pedigree (NA12877 and NA12878) at different percentages, we generated simulated tumor samples at different levels of purity3. This results in a range of simulated variant allele frequencies: for example, in a 40% NA12878–60% NA12878 admixture, a heterozygous variant from the sample used as tumor (NA12878) is present in the (perfectly) mixed biological samples at an expected VAF of 0.2, while a homozygous variant is present at a VAF of 0.4. In our experiment, the true frequency can deviate from these theoretical values due to factors such as sampling differences between the two sequencing data sets. We generated a series of admixture truth sets for each purity level that contains only variants private to the tumor sample (NA12878) and annotated with expected VAFs. Somatic calls for the simulated tumors (admixed samples) were produced using the DRAGEN Somatic Pipeline v3.6.34. Recall for true variants was calculated at a range of VAFs and sequencing depths by comparison to the truth set using the rtgtools vcfeval package5. In the admixture data set, we found that SNP recall drops significantly for VAFs ≤ 0.1, though this loss is partially mitigated by higher sequencing depths (Figure 2).
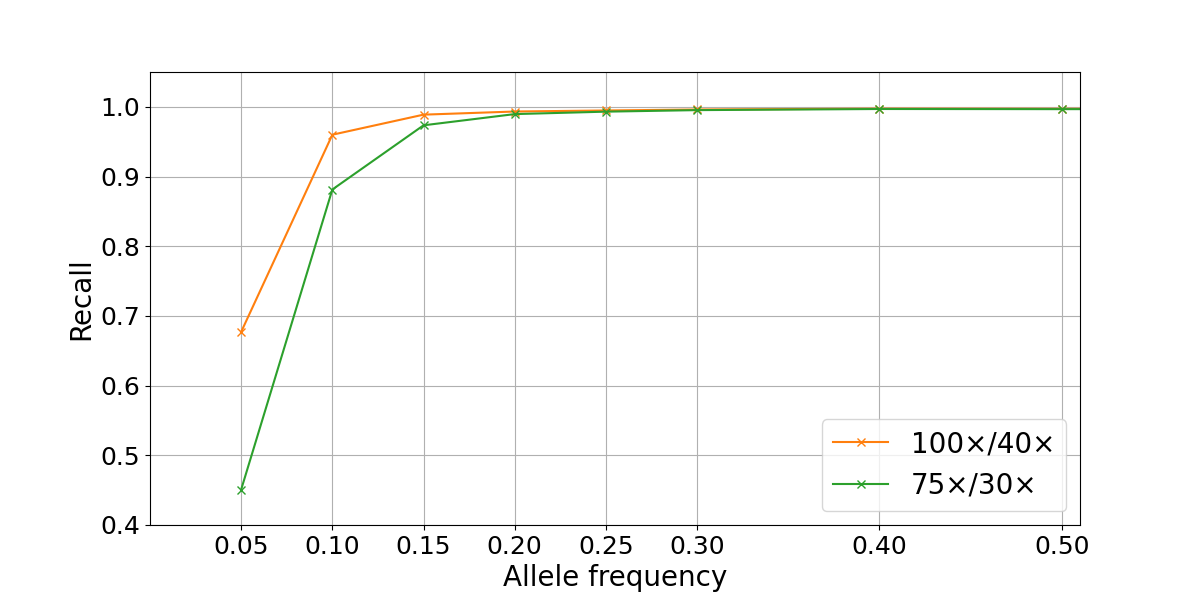
Figure 2: Somatic SNP recall by VAF in NA12878/NA12877 admixtures. Recall is computed on autosomes only for two sequencing depths combinations (100×/40× and 75×/30× for simulated tumor and normal samples).
3. Segmenting the genome by systematic quality
Per-base sequence quality metrics aggregated across many WGS samples can be used to identify anomalous genomic regions, as proposed in a previous blog post1. Specifically, for each metric we built a representative genome-wide distribution, fitted a Bayesian Gaussian mixture model to it, and identified sites with nonstandard behavior as the outliers of the distribution. We then labeled each position of the genome as high or low quality. Genomic locations where mapping quality, base calling quality, and depth showed standard behavior were labeled as high quality (89.9% of non-N autosomes - 2477 Mb), while locations at which at least one of the three metrics showed significant deviation from the genome-wide distribution were labeled as low quality (10.1% of non-N autosomes - 279 Mb) (Table 1). The analysis was limited to the non-N autosomal regions of the human genome.
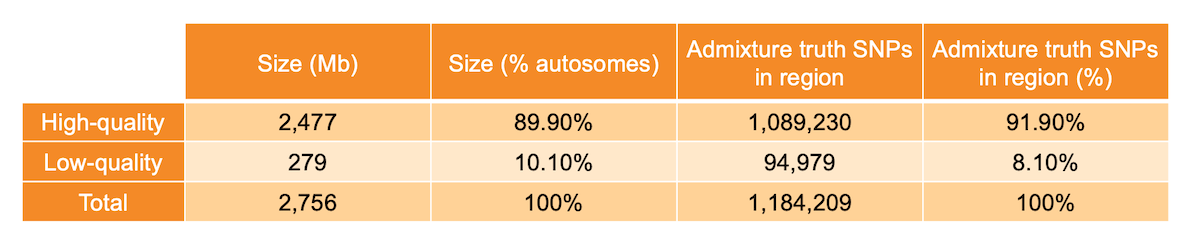
Table 1: High- and low-quality regions sizes and number of admixture SNPs present in the investigated region.
4. Stratifying somatic recall by local quality
We examined SNP recall in the high- and low-quality regions as previously defined for two different depth configurations. For both depth levels tested, the recall computed in high-quality regions closely approximated the theoretical recall described above down to ~0.15 allele frequency (Figure 3). At lower frequencies, it is likely that random fluctuations in depth lead to drops in recall compared to the theoretical predictions. Conversely, our analysis showed markedly poorer recall for the 10.1% of the genome defined as low quality.
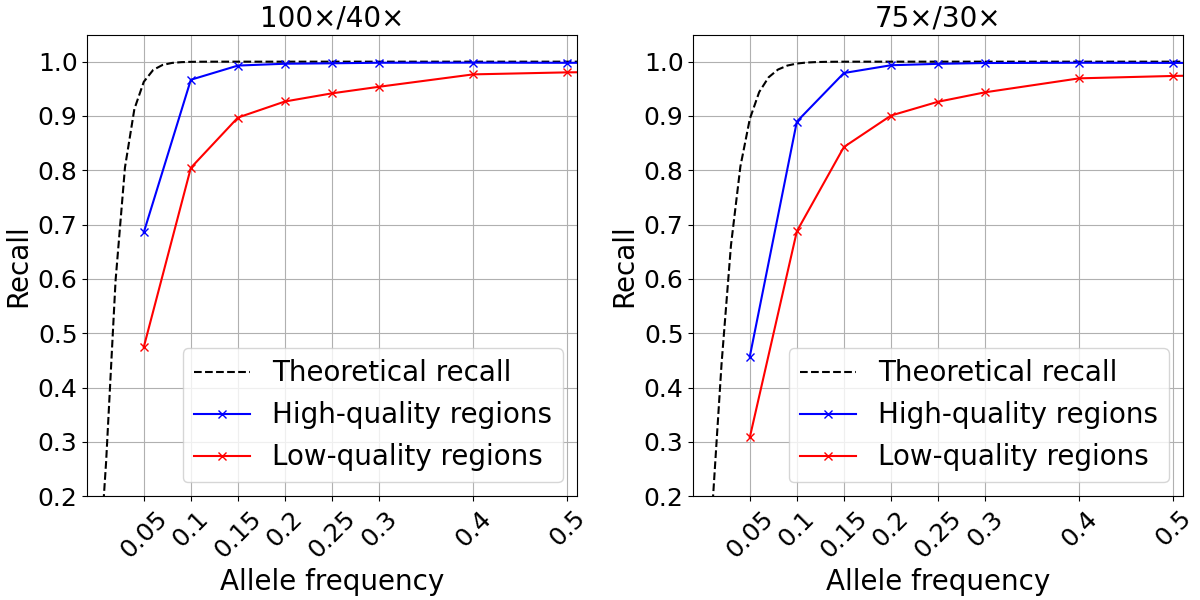
Figure 3: Somatic SNP recall in admixtures data sets in high-quality (blue) and low-quality (red) regions. Admixtures sequencing depth combinations are 100x/40x (left) and 75x/30x (right).
5. Quantifying false positive calls with normal/normal subtractions
We next quantified false-positive rates using the same sample as both tumor and normal in somatic subtractions. Because any true variant in the ‘tumor’ sample will also exist in the ‘normal’ sample, any resulting call is a false positive. Normal/normal subtractions showed low levels of false-positive SNPs genome-wide (274 at 100×/40× and 196 at 75×/30×) (Figure 4). Despite their low overall frequency, false positives cluster in low systematic quality regions. Specifically, 86-89% of the false-positive SNVs were found in low-quality regions. This means that a simple filter that excludes all low-quality regions would remove most of the false positives at a cost of reducing the true positives by ~10%.

Figure 4: Normal/normal subtraction yields 236 false-positive SNPs in low-quality regions and 38 in high-quality regions at 100x/40x (left) and 176 false-positive SNPs in low-quality regions and 20 in high-quality regions at 100x/40x (right). False-positive density is computed as the number of false-positive SNPs divided by the size of the region in Mb.
Discussion
Using empirically defined systematic quality enables effective identification of genomic regions characterized by high sequencing performance. Here, we demonstrated that those regions are also characterized by a higher recall and lower false-positive density with respect to regions with low systematic quality.
We also show that recall performance achieved in high systematic quality regions approximates the theoretical limit for both tested depths. This suggests that deep sequencing might be the only strategy for confidently calling low-frequency variants in low-quality regions. Conversely, in high systematic quality regions, which account for 89.9% of the genomic positions, 100× and 75× sequencing guarantees a high level of recall for variants with allele frequencies greater than 15% and a low false-positive rate.
References
- Bekritsky MA, Colombo C, Eberle MA. Identifying Genomic Regions with High Quality Single Nucleotide Variant Calling. Illumina website. Accessed February 16, 2022.
- Eberle MA, Fritzilas E, Krusche P, et al. A reference data set of 5.4 million phased human variants validated by genetic inheritance from sequencing a three-generation 17-member pedigree. Genome Res. 2017;27(1):157-164. doi:10.1101/gr.210500.116
- Illumina. Evaluating Somatic Variant Calling in Tumor/Normal Studies. Published March 21, 2014. Accessed February 16, 2022.
- Illumina. DRAGEN somatic. Accessed February 16, 2022.
- Real Time Genomics. RTG Tools. Accessed February 16, 2022.